Investor Relations
Key Management Indicators
Profitability and Growth
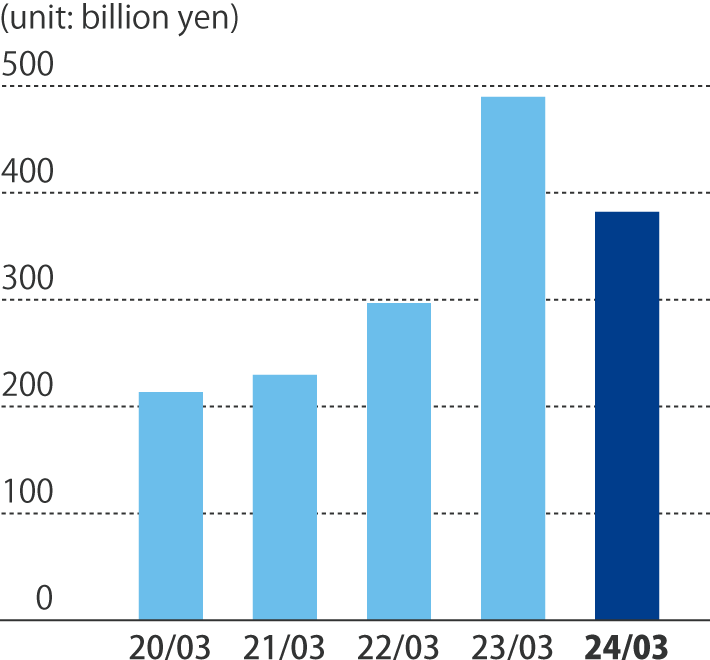 Operating cash flow
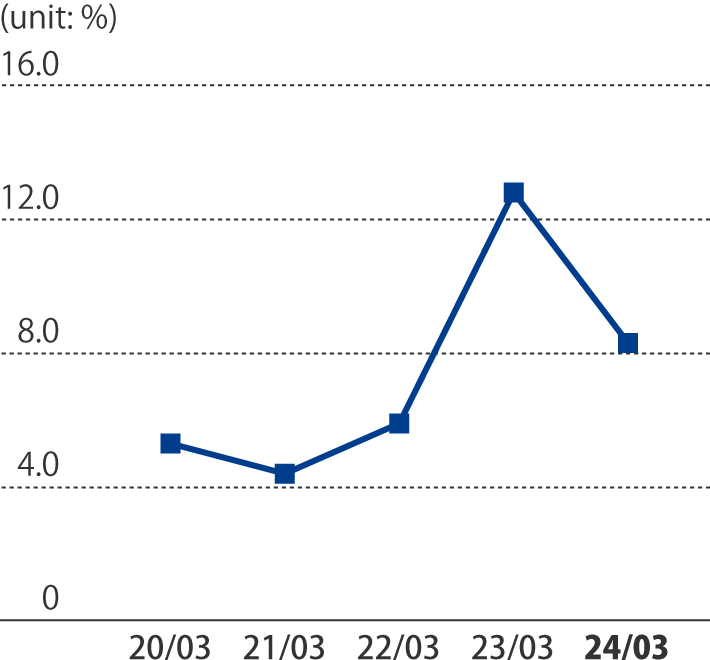 Operating Profit Margin
Definition
(unit: billion yen)
2021.3 |
2022.3 |
2023.3 |
2024.3 |
2025.3 |
|
|---|---|---|---|---|---|
| Operating cash flow | 229.3 | 296.6 | 490.2 | 379.3 | 342.4 |
| Capital expenditures | 246.4 | 207.2 | 213.2 | 205.2 | 320.7 |
| Depreciation* | 179.8 | 200.9 | 209.3 | 213.8 | 268.2 |
Definition 1 Operating cash flow = net Profit + amortization of long-term prepaid expenses + depreciation
* Depreciation includes amortization of long-term prepayments
(unit: %)
2021.3 |
2022.3 |
2023.3 |
2024.3 |
2025.3 |
|
|---|---|---|---|---|---|
| Operating Profit Margin | 4.4 | 5.9 | 12.8 | 8.2 | 5.1 |
| Net Profit Margin | 2.8 | 4.4 | 8.5 | 6.2 | 2.8 |
Efficiency
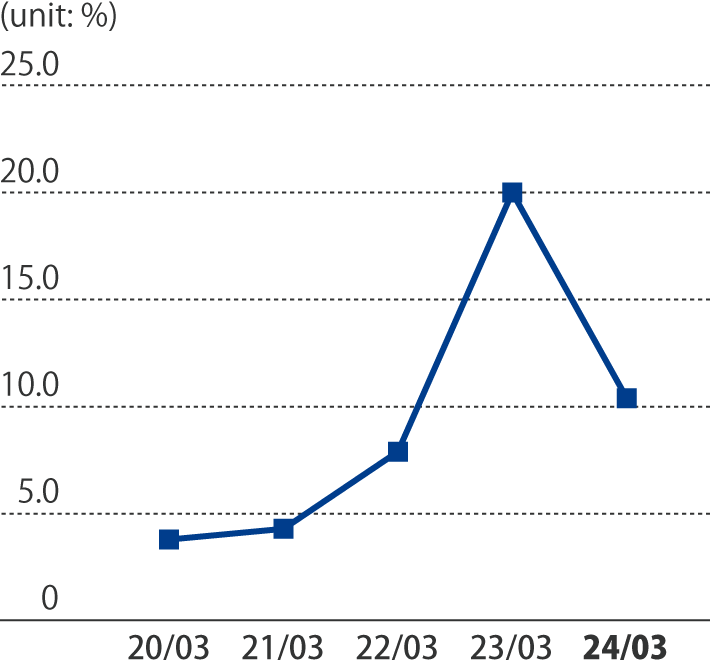 ROE (Return On Equity)
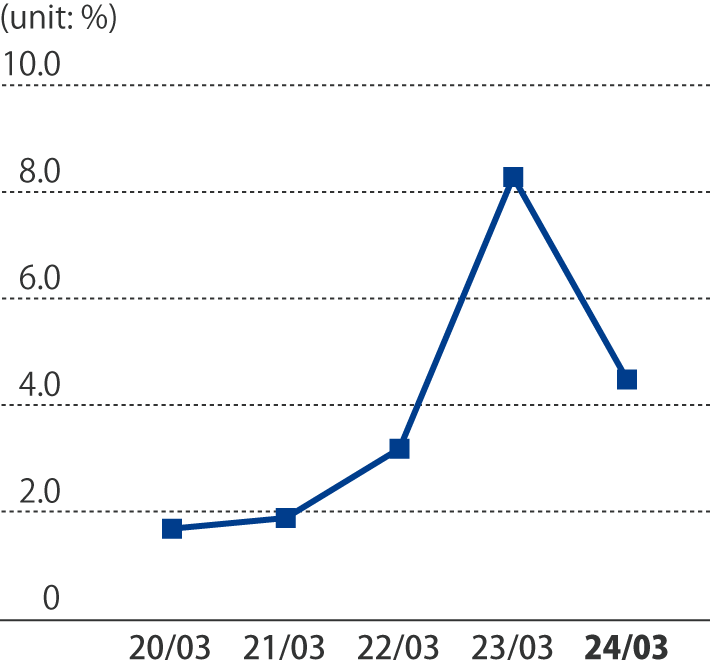 ROA (Return On Asset)
Definition
(unit: %)
2021.3 |
2022.3 |
2023.3 |
2024.3 |
2025.3 |
|
|---|---|---|---|---|---|
| ROE (Return On Equity)* | 4.3 | 7.9 | 20.0 | 10.2 | 4.3 |
| ROA (Return On Asset)* | 1.9 | 3.2 | 8.3 | 4.4 | 1.9 |
Definition 2 ROE = net profit / total equity (average of positions at start and end of fiscal year)
Definition 3 ROA = net profit / total assets (average of positions at start and end of fiscal year)
* ROA, ROE for FY2023 (March 31, 2024) is after retrospective application of the U.S. GAAP (Tokyo Gas America and its consolidated subsidiaries)
Soundness
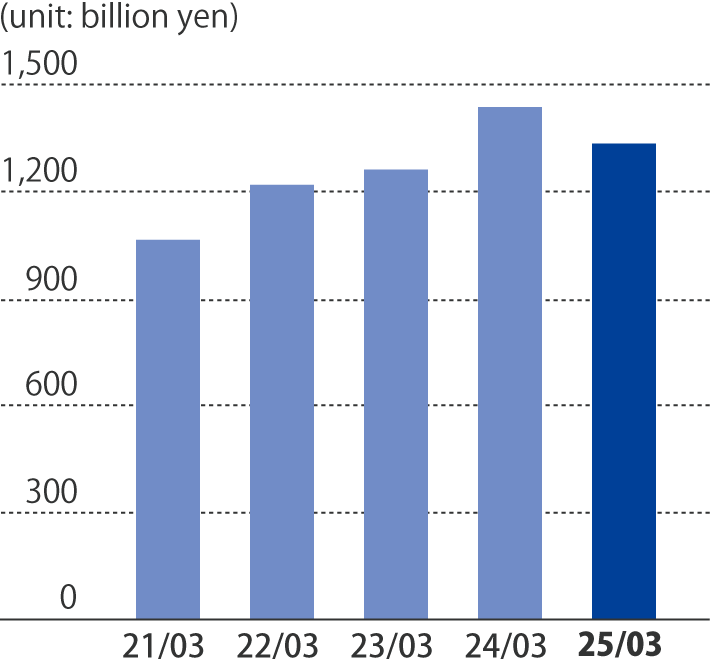 Interest-bearing debt
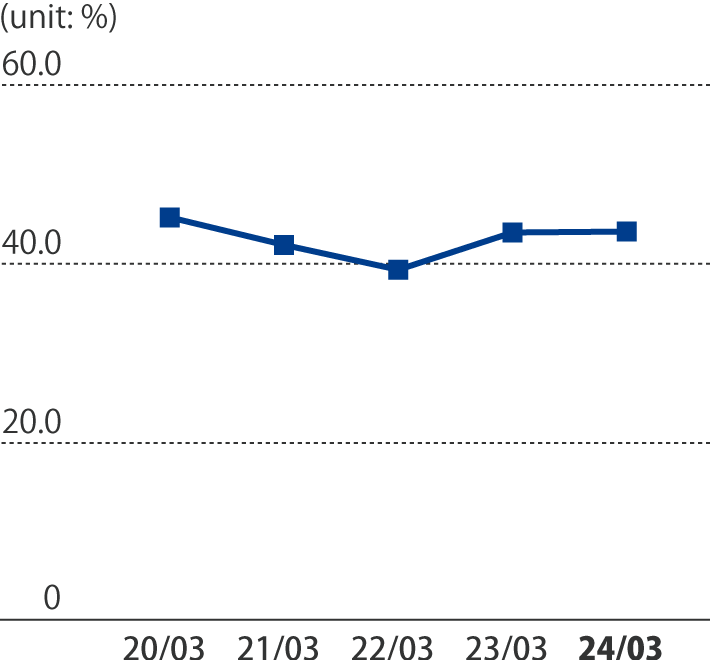 Equity ratio
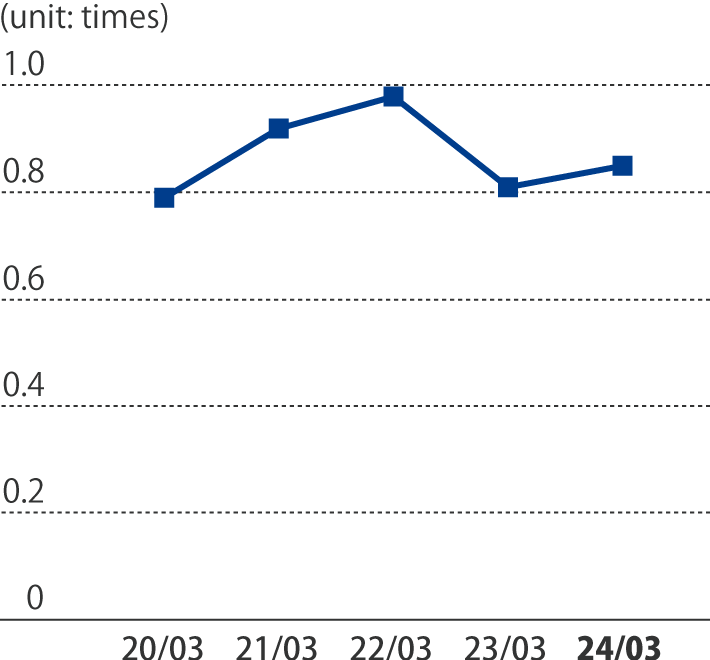 D/E ratio
Definition
2021.3 |
2022.3 |
2023.3 |
2024.3 |
2025.3 |
|
|---|---|---|---|---|---|
| Interest-bearing debt (billion yen) | 1,065.9 | 1,220.5 | 1,263.2 | 1,439.2 | 1,336.2 |
| Equity ratio (%) | 42.1 | 39.3 | 43.5 | 43.4 | 44.8 |
| D/E ratio (times) | 0.92 | 0.98 | 0.81 | 0.85 | 0.77 |
Definition 4 Equity ratio = equity (year-end) / total assets (year-end) x100
Definition 5 Debt-equity ratio = interest-bearing debt (year-end) / total shareholders' equity (year-end)
Performance Indicators
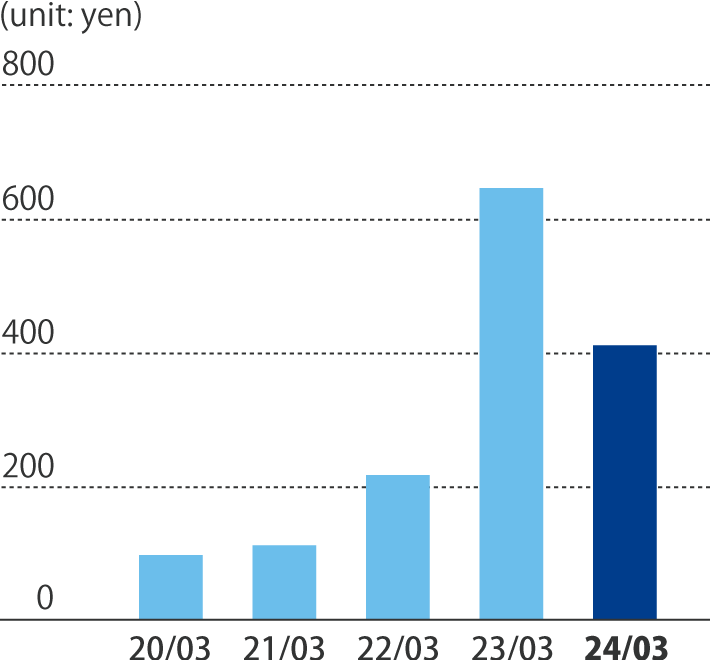 EPS (Earnings per Share, adjusted for latent shares)
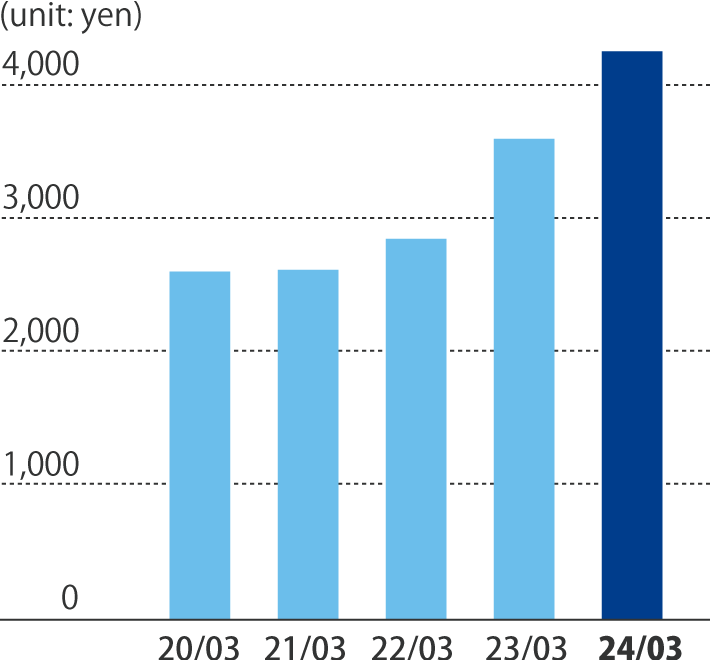 BPS (Book Value per Share)
Definition
(unit: yen)
2021.3 |
2022.3 |
2023.3 |
2024.3 |
2025.3 |
|
|---|---|---|---|---|---|
| EPS (Earnings per Share, fully diluted EPS) | 112.3 | 217.7 | 647.0 | 401.1 | 192.2 |
| BPS (Book Value per Share) | 2,616.4 | 2,847.9 | 3,595.6 | 4,244.1 | 4,669.4 |
| PER (Price Earnings Ratio) (times) | 21.94 | 10.25 | 3.86 | 8.75 | 24.78 |
| PBR (Price Book Value Ratio) (times) | 0.94 | 0.78 | 0.69 | 0.83 | 1.02 |
Definition 6 EPS = net profit/average number of issued shares
Definition 7 BPS = equity/number of issued shares (year-end)


