Investor Relations
Financial Highlights
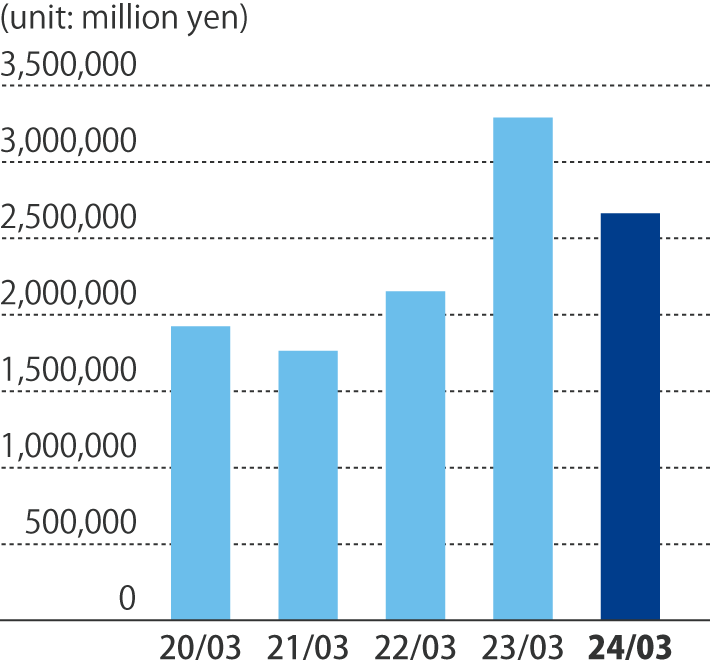 Net sales
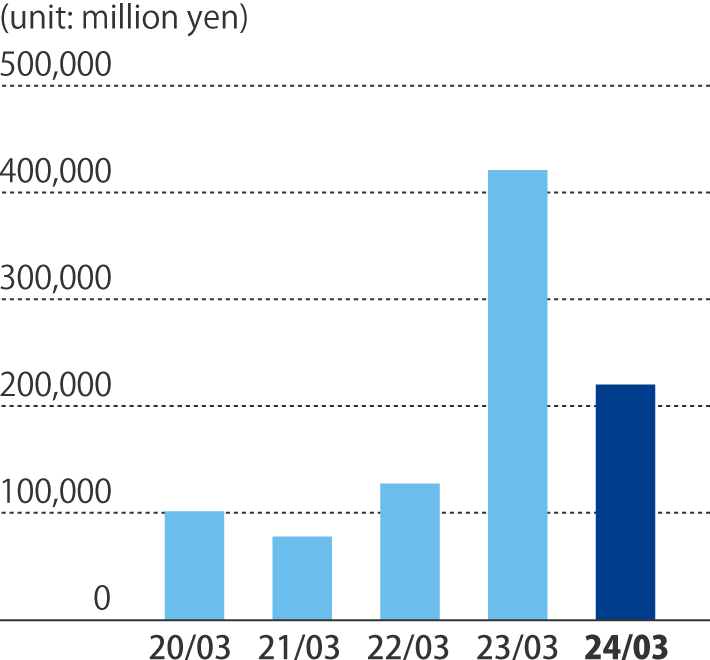 Operating profit
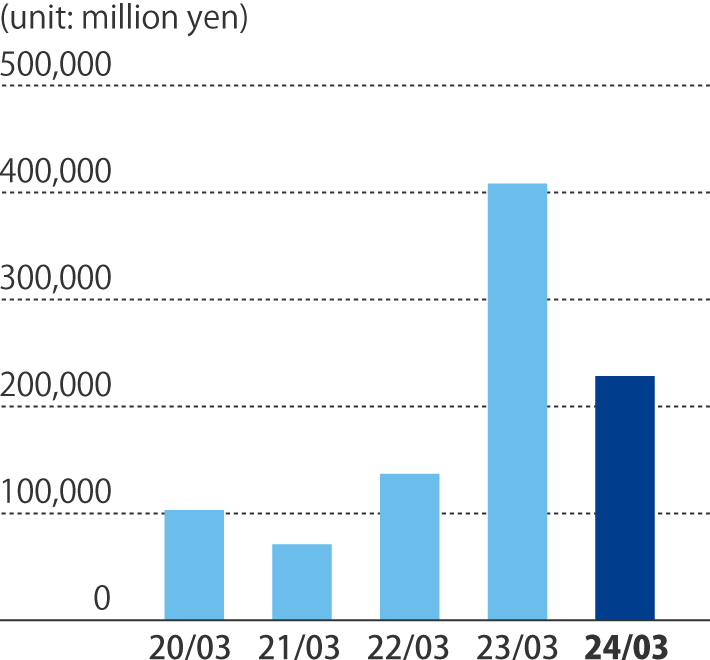 Ordinary profit
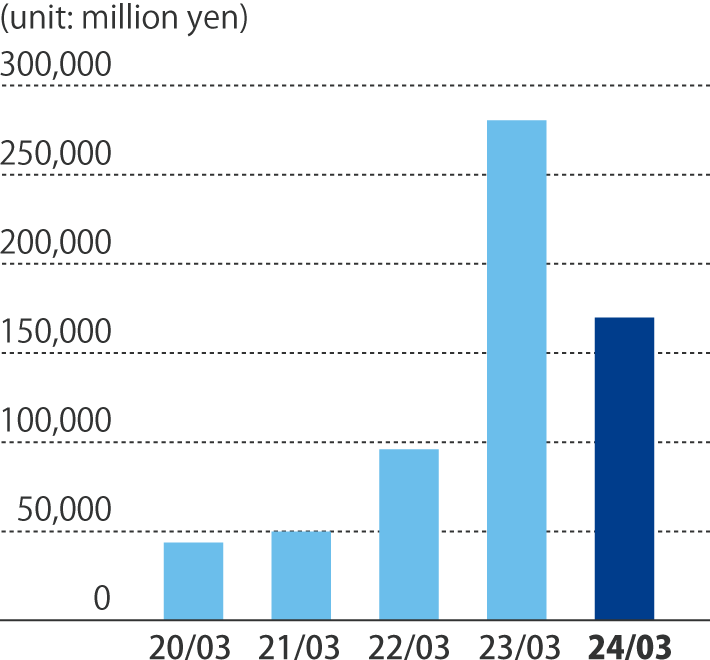 Profit attributable to owners of parent
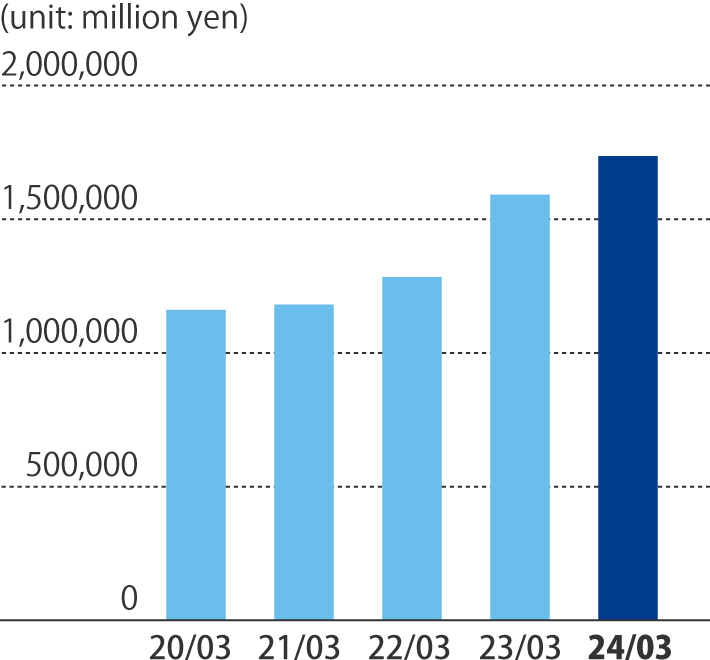 Net assets
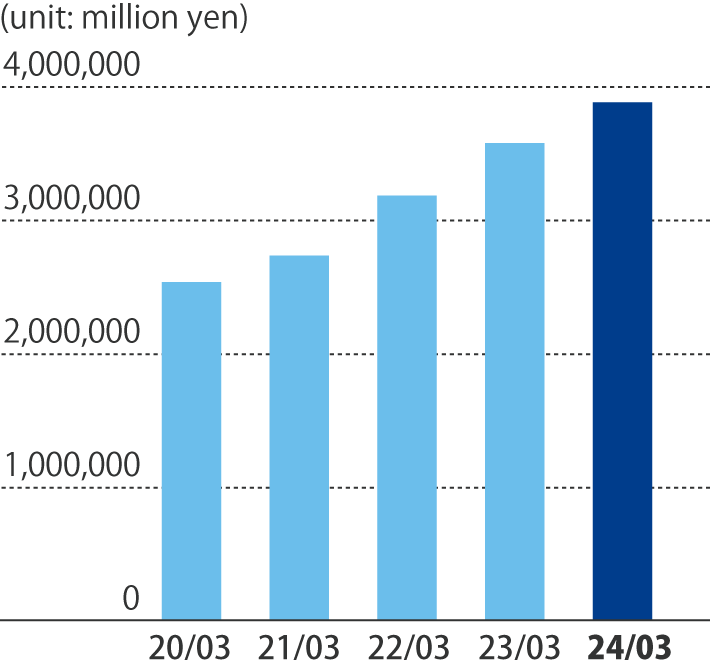 Total assets
Total Shareholder Return
(unit: %)
2021.3 |
2022.3 |
2023.3 |
2024.3 |
2025.3 |
|
|---|---|---|---|---|---|
| Total Shareholder Return | 98.7 | 92.2 | 105.1 | 147.5 | 199.6 |
Financial Highlights (consolidated)
(unit : billion yen)
2021.3 |
2022.3 |
2023.3 |
2024.3 |
2025.3 |
|
|---|---|---|---|---|---|
| Net sales | 1,765.1 | 2,154.8 | 3,289.6 | 2,662.4 | 2,636.8 |
| Operating profit | 77.6 | 127.5 | 421.4 | 217.1 | 133.0 |
| Ordinary profit | 70.5 | 136.4 | 408.8 | 222.7 | 113.5 |
| Profit attributable to owners of parent | 49.5 | 95.7 | 280.9 | 165.4 | 74.1 |
| Net assets | 1,178.2 | 1,281.1 | 1,589.3 | 1,758.8 | 1,801.4 |
| Total assets | 2,738.3 | 3,187.6 | 3,581.4 | 3,897.6 | 3,855.0 |


